
I’ve written before that the prompts of Depth and Complexity must be combined with various levels of Bloom’s Taxonomy to unlock their true power. Otherwise we’re just asking kids to identify, identify, identify – a low level thinking skill.
Graphic organizers are one way to scaffold higher-order thinking skills. Many graphic organizers connect perfectly to a certain level of Bloom’s. The Venn Diagram, for example, helps students reach the analyze level of Bloom’s by comparing and contrasting. A circle map is great for brainstorming or simply listing everything we know.
We can combine graphic organizers, depth and complexity, and our Bloom’s Taxonomy for higher-level thinking experiences.
⚠️ Note: Students should draw out their own graphic organizers. Their task becomes less about “fill in the blanks my teacher gave me” and more about the thinking. They can also adjust their organizer’s size more easily. I also think kids should be sketching the depth and complexity icons by hand or just typing in emoji icons.
Circle Map
The circle map, the simplest of Thinking Maps, is all about unstructured brainstorming. But you could prompt students to brainstorm patterns specifically. Or divide the map and look for examples of patterns vs rules.

Venn Diagram
Rather than just asking students to compare and contrast Washington and Lincoln, we could prompt them with a thinking tool such as ethics. When they create their graphic organizer, ask them to also sketch in the ethics tool. Now they’re comparing and contrasting the ethical issues which faced the two presidents.

Or compare and contrast the patterns of Jupiter vs Saturn, the perspectives of two characters, or how two species have changed over time.
Multi-Flow
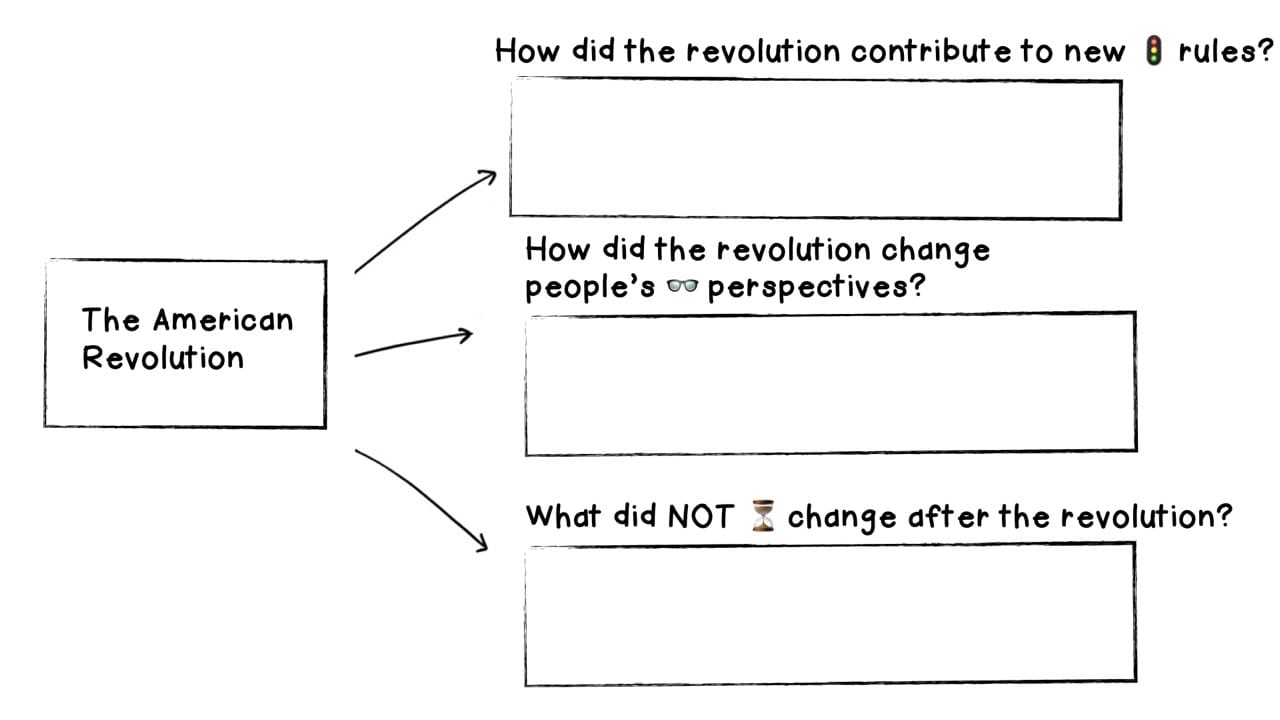
The multi-flow map, from Thinking Maps, shows the causes and effects of an event, idea, etc. I especially like breaking it into just the causes or just the effects so students can go deeper. Layering a prompt of depth and complexity onto this graphic organizer, we might look at the rules, points of view, and changes that caused the American Revolution.

Or we could look at what rules, points of view, and changes resulted from the American Revolution.
When working with negative numbers, what new patterns emerge in our calculations?

Big Idea
The big idea icon itself is a great graphic organizer. The roof holds a “big idea” or generalization and the columns hold supporting evidence. Layer in Depth and Complexity prompts within the columns. One column might hold patterns that support the generalization while one holds specific perspectives.

Combine depth and complexity with just about any graphic organizer to push students’ thinking to new levels. And be open to their thoughts! Kids might have a great way to layer in depth and complexity with a graphic organizer as well.
BUT!
🚫 Graphic organizers should not be a final product! They should lead to something. An essay, a presentation, a diorama, a skit, a video, etc. Far too many of my lessons ended with a graphic organizer. Kids need to flex their muscles and produce a true culminating product.
A graphic organizer is the perfect “in-between” tool. It helps students gather their thoughts and organize them according to a certain type of thinking. It helps them to make their thinking visible. Graphic organizers make great checkpoints. You can peek at students’ processes to see if they’re headed in the right direction before they begin their final product.
But Venn Diagrams or Multi-Flow Maps should rarely be the final product. Class walls shouldn’t be covered in graphic organizers, but rather, interesting student products.