“I use Byrdseed to differentiate for my clustered students. I LOVE all the ideas!” ~ a teacher in Washington
Let’s make some intentionally bad graphs to learn how to spot poorly made graphs.
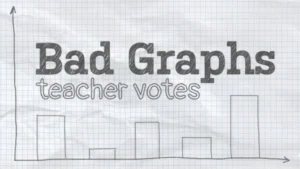
One bar looks twice as tall, but the vote was nearly a tie. Students uncover the sneaky scale, then build their own misleading graph.
Mr. Boid’s graph says he won in a blowout. But it was really a tie.
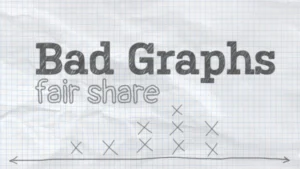
Mr. Boid says the juice is split fairly. So why do three kids have empty cups?